During 2015 it was developed an extensive characterization study of EDP’s purchases, aiming a deeper knowledge about the economic, social and environmental impacts of EDP’s supply chain. EDP expects from now on to use these results for better definition of the priorities concerning sustainability management.

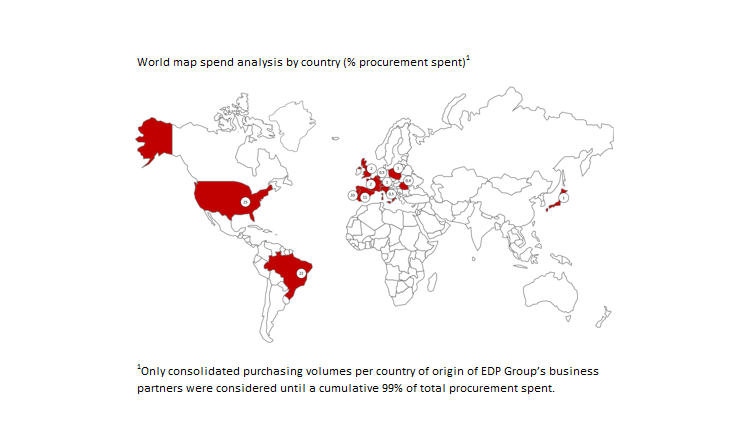
The purchase of fuel, the construction of energy facilities, the purchase and maintenance of equipment and service contracting related to distributional and commercial activities of energy are groups of supply categories that define the fundamental profile of the Group’s supply chain. On the map there is illustrated the origin of EDP suppliers by country and in the immediate tables the origin of purchases by EDP structure.

Supplier breakdown by procurement structure (1)
Suppliers
Suppliers > 150,000 EUR
Turnover
Local
Group (2)
16 051
1 487
3 146 M€
97%
Portugal (3)
4 758
455
766 M€
94%
Spain (3)
Suppliers 2018
2 029
219
Turnover 2018
240 M€
89%
Brazil (3)
4 851
407
525 M€
99%
EDPR NA (4))
529
175
785 M€
100%
EDPR EU+BR (5)
4 470
271
829 M€
97%
Supplier breakdown by procurement structure (1)
Group (2)
Portugal (3)
Spain (3)
Brazil (3)
EDPR NA (4))
EDPR EU+BR (5)
Suppliers 2018
Suppliers
16 051
4 758
2 029
4 851
529
4 470
Suppliers > 150,000 EUR
1 487
455
219
407
175
271
Turnover 2018
Turnover
3 146 M€
766 M€
240 M€
525 M€
785 M€
829 M€
Local
97%
94%
89%
99%
100%
97%
Notes:

1) Fuel purchases not included.
2) In the total number of EDP Group suppliers, business partners supplying in more than one geography are accounted only one time.
3) EDPR not included.
4) North America – included: the USA, Canada and Mexico
5) All operations of EDP Renewables (considered: Belgium, Brazil, Spain, France, Italy, Poland, Portugal, UK and Romania)

Fuel Purchases (1)
Suppliers
Turnover
Local
Unit
#
M€
%
Group
Suppliers 2018
61
Turnover 2018
1 296
52
Portugal (2)
22
490
40
Spain (2)
32
641
72
Brazil (2)
7
165
11
Fuel Purchases (1)
Unit
Group
Portugal (2)
Spain (2)
Brazil (2)
Suppliers 2018
Suppliers
#
61
22
32
7
Turnover 2018
Turnover
M€
1 296
490
641
165
Local
%
52
40
72
11
Notes:

1) Includes fuel purchases and services associated.
2) In the total number of EDP Group suppliers, business partners supplying in more than one geography are accounted only one time.

Suppliers
ISO 9001
ISO 14001
OHSAS 18001
Colombia
USA
South Africa
Russia
Spain
Unit
Certified Fuel Suppliers 2018
%
%
%
Coal Origin 2018
%
%
%
%
%
Value
82
82
81
79
10
2
9
0,01
Suppliers
Unit
Value
Certified Fuel Suppliers 2018
ISO 9001
%
82
ISO 14001
%
82
OHSAS 18001
%
81
Coal Origin 2018
Colombia
%
79
USA
%
10
South Africa
%
2
Russia
%
9
Spain
%
0,01

The tables below show the impact of EDP purchases under some dimensions. It is, however, a synthetic information that does not show the depth of the information available. The study, developed by PWC and based on ESCHER methodology, details data by: country (not only where EDP operates), relevant purchases categories and suppliers.

It can be highlighted the most relevant economic impacts:

  • the employment volume induced by EDP in its supply chain which reached 177 thousand jobs and 326 million hours worked with direct suppliers representing 44% of the total workforce;
  • the importance of the capital intensive purchasing represents 55% (raw materials, equipments), compared with 45% related to labour-intensive (provision of services);
  • the value created by EDP purchases is mostly retained in the countries where EDP operates: retention of 70% of value of purchases, 59% of jobs and 79% of wages.

EDP, through its direct suppliers, is exposed to a relatively low social risk. Risks such as child labour, forced labour or occupational health & safety came out as very low risk control priorities should be given to low wages (0,27% of direct purchasing). The main risk from the social perspective came out as being the gender equity, representing 18,34% of direct purchasing.

Under the category “Country”, 7% of direct purchasing is exposed to political instability, rule of law ineffectiveness and government effectiveness fragility, but the most relevant risk is corruption, covering around 10,3% of direct purchasing.

However, when the scope is indirect purchasing, results are significantly different.

The table reveals a dramatic high increase of risk exposure, namely child labour (0,54%), forced or compulsory labour (0,39%), occupational health and safety (7,9%), excessive working hours (1,4%) and low wage (13,4%). Gender equity is still the most relevant risk, increasing to 25,7%. The increase of risks is also expressively present in the dimensions related to rule of law, government effectiveness and corruption.

Following this study, managing sustainability in EDP’s supply chain will need new processes in place to give EDP guaranties that direct suppliers endorses commitments in the improvement of labour and social conditions of its own supply chain.

EDP impacts on environment are also relevant. These are clearly linked to the environmental costs from extraction and transport of raw material, where gas and coal are dominant. EDP will continue this work, promoting energy efficiency initiatives on its suppliers, as well as the reduction of waste towards an improvement of the circular economy.

ECONOMIC IMPACTS
Gross value added related to purchases
Gross value added related to purchases in countries of operation
Gross value added - Capital intensive purchases
Employment related to purchases
Employment related to direct purchases
Skilled Employment related to purchases
Employment related to purchases in countries of operation
Employment related to raw materials purchases
Employment resulting from raw materials direct purchases
Working hours related to purchases
Working hours related to direct purchases
Salaries related to purchases
Salaries related to purchases in countries of operation
Salaries resulting from raw materials
Salaries resulting from raw materials direct purchases
Taxes related to purchases
Taxes related to purchases in countries of operation
Taxes resulting from raw materials purchases
Taxes resulting from raw materials direct purchases
Profits related to purchases
Profits related to purchases in countries of operation
Profits resulting from raw materials purchases
Profits resulting from raw materials direct purchases
Unit
GVA
000.000 EUR
%
%
EMPLOYMENT
#
%
%
%
%
%
000.000 hours
%
SALARIES
000.000 EUR
%
000.000 EUR
%
TAXES
000.000 EUR
%
000.000 EUR
%
PROFITS
000.000 EUR
%
000.000 EUR
%
Value
4588
70.0
55.5
177323
44.0
29.0
59.0
31.0
11.0
326
44.0
1965
79.0
482
24.0
90
31.0
55
30.0
1894
62.0
920
40.7
ECONOMIC IMPACTS
Unit
Value
GVA
Gross value added related to purchases
000.000 EUR
4588
Gross value added related to purchases in countries of operation
%
70.0
Gross value added - Capital intensive purchases
%
55.5
EMPLOYMENT
Employment related to purchases
#
177323
Employment related to direct purchases
%
44.0
Skilled Employment related to purchases
%
29.0
Employment related to purchases in countries of operation
%
59.0
Employment related to raw materials purchases
%
31.0
Employment resulting from raw materials direct purchases
%
11.0
Working hours related to purchases
000.000 hours
326
Working hours related to direct purchases
%
44.0
SALARIES
Salaries related to purchases
000.000 EUR
1965
Salaries related to purchases in countries of operation
%
79.0
Salaries resulting from raw materials
000.000 EUR
482
Salaries resulting from raw materials direct purchases
%
24.0
TAXES
Taxes related to purchases
000.000 EUR
90
Taxes related to purchases in countries of operation
%
31.0
Taxes resulting from raw materials purchases
000.000 EUR
55
Taxes resulting from raw materials direct purchases
%
30.0
PROFITS
Profits related to purchases
000.000 EUR
1894
Profits related to purchases in countries of operation
%
62.0
Profits resulting from raw materials purchases
000.000 EUR
920
Profits resulting from raw materials direct purchases
%
40.7
RELATED TO DIRECT AND INDIRECT PURCHASES
Voice and Accountability
Political Stability and Absence of Violence/Terrorism
Regulatory Quality
Government Effectiveness
Rule of Law
Control of Corruption
Child Labor
Forced Labor
Occupational Health & Safety Risk
High Working Hours
Low Wages
Gender equity
unit
%
%
%
%
%
%
%
%
%
%
%
%
Tier 1
0.0
7.1
0.0
7.3
7.1
10.3
0.0
0.0
0.0
0.0
0.3
18.3
RELATED TO DIRECT AND INDIRECT PURCHASES
unit
Tier 1
Voice and Accountability
%
0.0
Political Stability and Absence of Violence/Terrorism
%
7.1
Regulatory Quality
%
0.0
Government Effectiveness
%
7.3
Rule of Law
%
7.1
Control of Corruption
%
10.3
Child Labor
%
0.0
Forced Labor
%
0.0
Occupational Health & Safety Risk
%
0.0
High Working Hours
%
0.0
Low Wages
%
0.3
Gender equity
%
18.3
Environmental Impacts
Land Use related to total purchases
Land Use related to direct purchases
Land Use related to raw materials
Land Use related to purchases in countries of operation
GHG emissions related to total purchases
GHG emissions related to direct purchases
GHG emissions related to raw materials
GHG emissions related to purchases in countries of operation
Water consumption related to total purchases
Water consumption related to direct purchases
Water consumption related to raw materials
Water consumption related to purchases in countries of operation
Unit
LAND USE RELATED TO PURCHASES
ha
%
%
%
GHG EMISSIONS RELATED TO PURCHASES (1)
000 t CO2eq
%
%
%
WATER CONSUMPTION RELATED TO PURCHASES
000.000 m3
%
%
%
Value
199193
0.8
20.0
62.0
3931
23
56
78
41825
13
29
51
Environmental Impacts
Unit
Value
LAND USE RELATED TO PURCHASES
Land Use related to total purchases
ha
199193
Land Use related to direct purchases
%
0.8
Land Use related to raw materials
%
20.0
Land Use related to purchases in countries of operation
%
62.0
GHG EMISSIONS RELATED TO PURCHASES (1)
GHG emissions related to total purchases
000 t CO2eq
3931
GHG emissions related to direct purchases
%
23
GHG emissions related to raw materials
%
56
GHG emissions related to purchases in countries of operation
%
78
WATER CONSUMPTION RELATED TO PURCHASES
Water consumption related to total purchases
000.000 m3
41825
Water consumption related to direct purchases
%
13
Water consumption related to raw materials
%
29
Water consumption related to purchases in countries of operation
%
51
Notes:

1) There is a difference between the values of these emissions and Scope 3 calculation. This is due to the exclusion of end-use consumption and net electricity purchases.